The following maps are a result of the collection of results from these three different databases (OSPAR, HELCOM and Marine LitterWatch) where the information was recalculated per category to an average number of collected items per 100 meter beach, and was later transformed into its visualization on three regional maps representing the North Sea, Baltic Sea and the Mediterranean Sea basins.
Updated Maps
Given the availability of new information, D2.2 Knowledge Wave on Marine Litter from Aquaculture Sources - updated was updated, which further resulted in the creation of new maps.
These maps intend to get a clear view of the wide range of data by relating the % of litter originating from aquaculture and/or fisheries to the fate (beach, floating and seafloor litter) of the collected litter.
------------------------------------------------------------------------------------------
Beach
The monitored beaches in the North, Baltic and Mediterranean Sea basins and their reported percentage of
aquaculture related litter
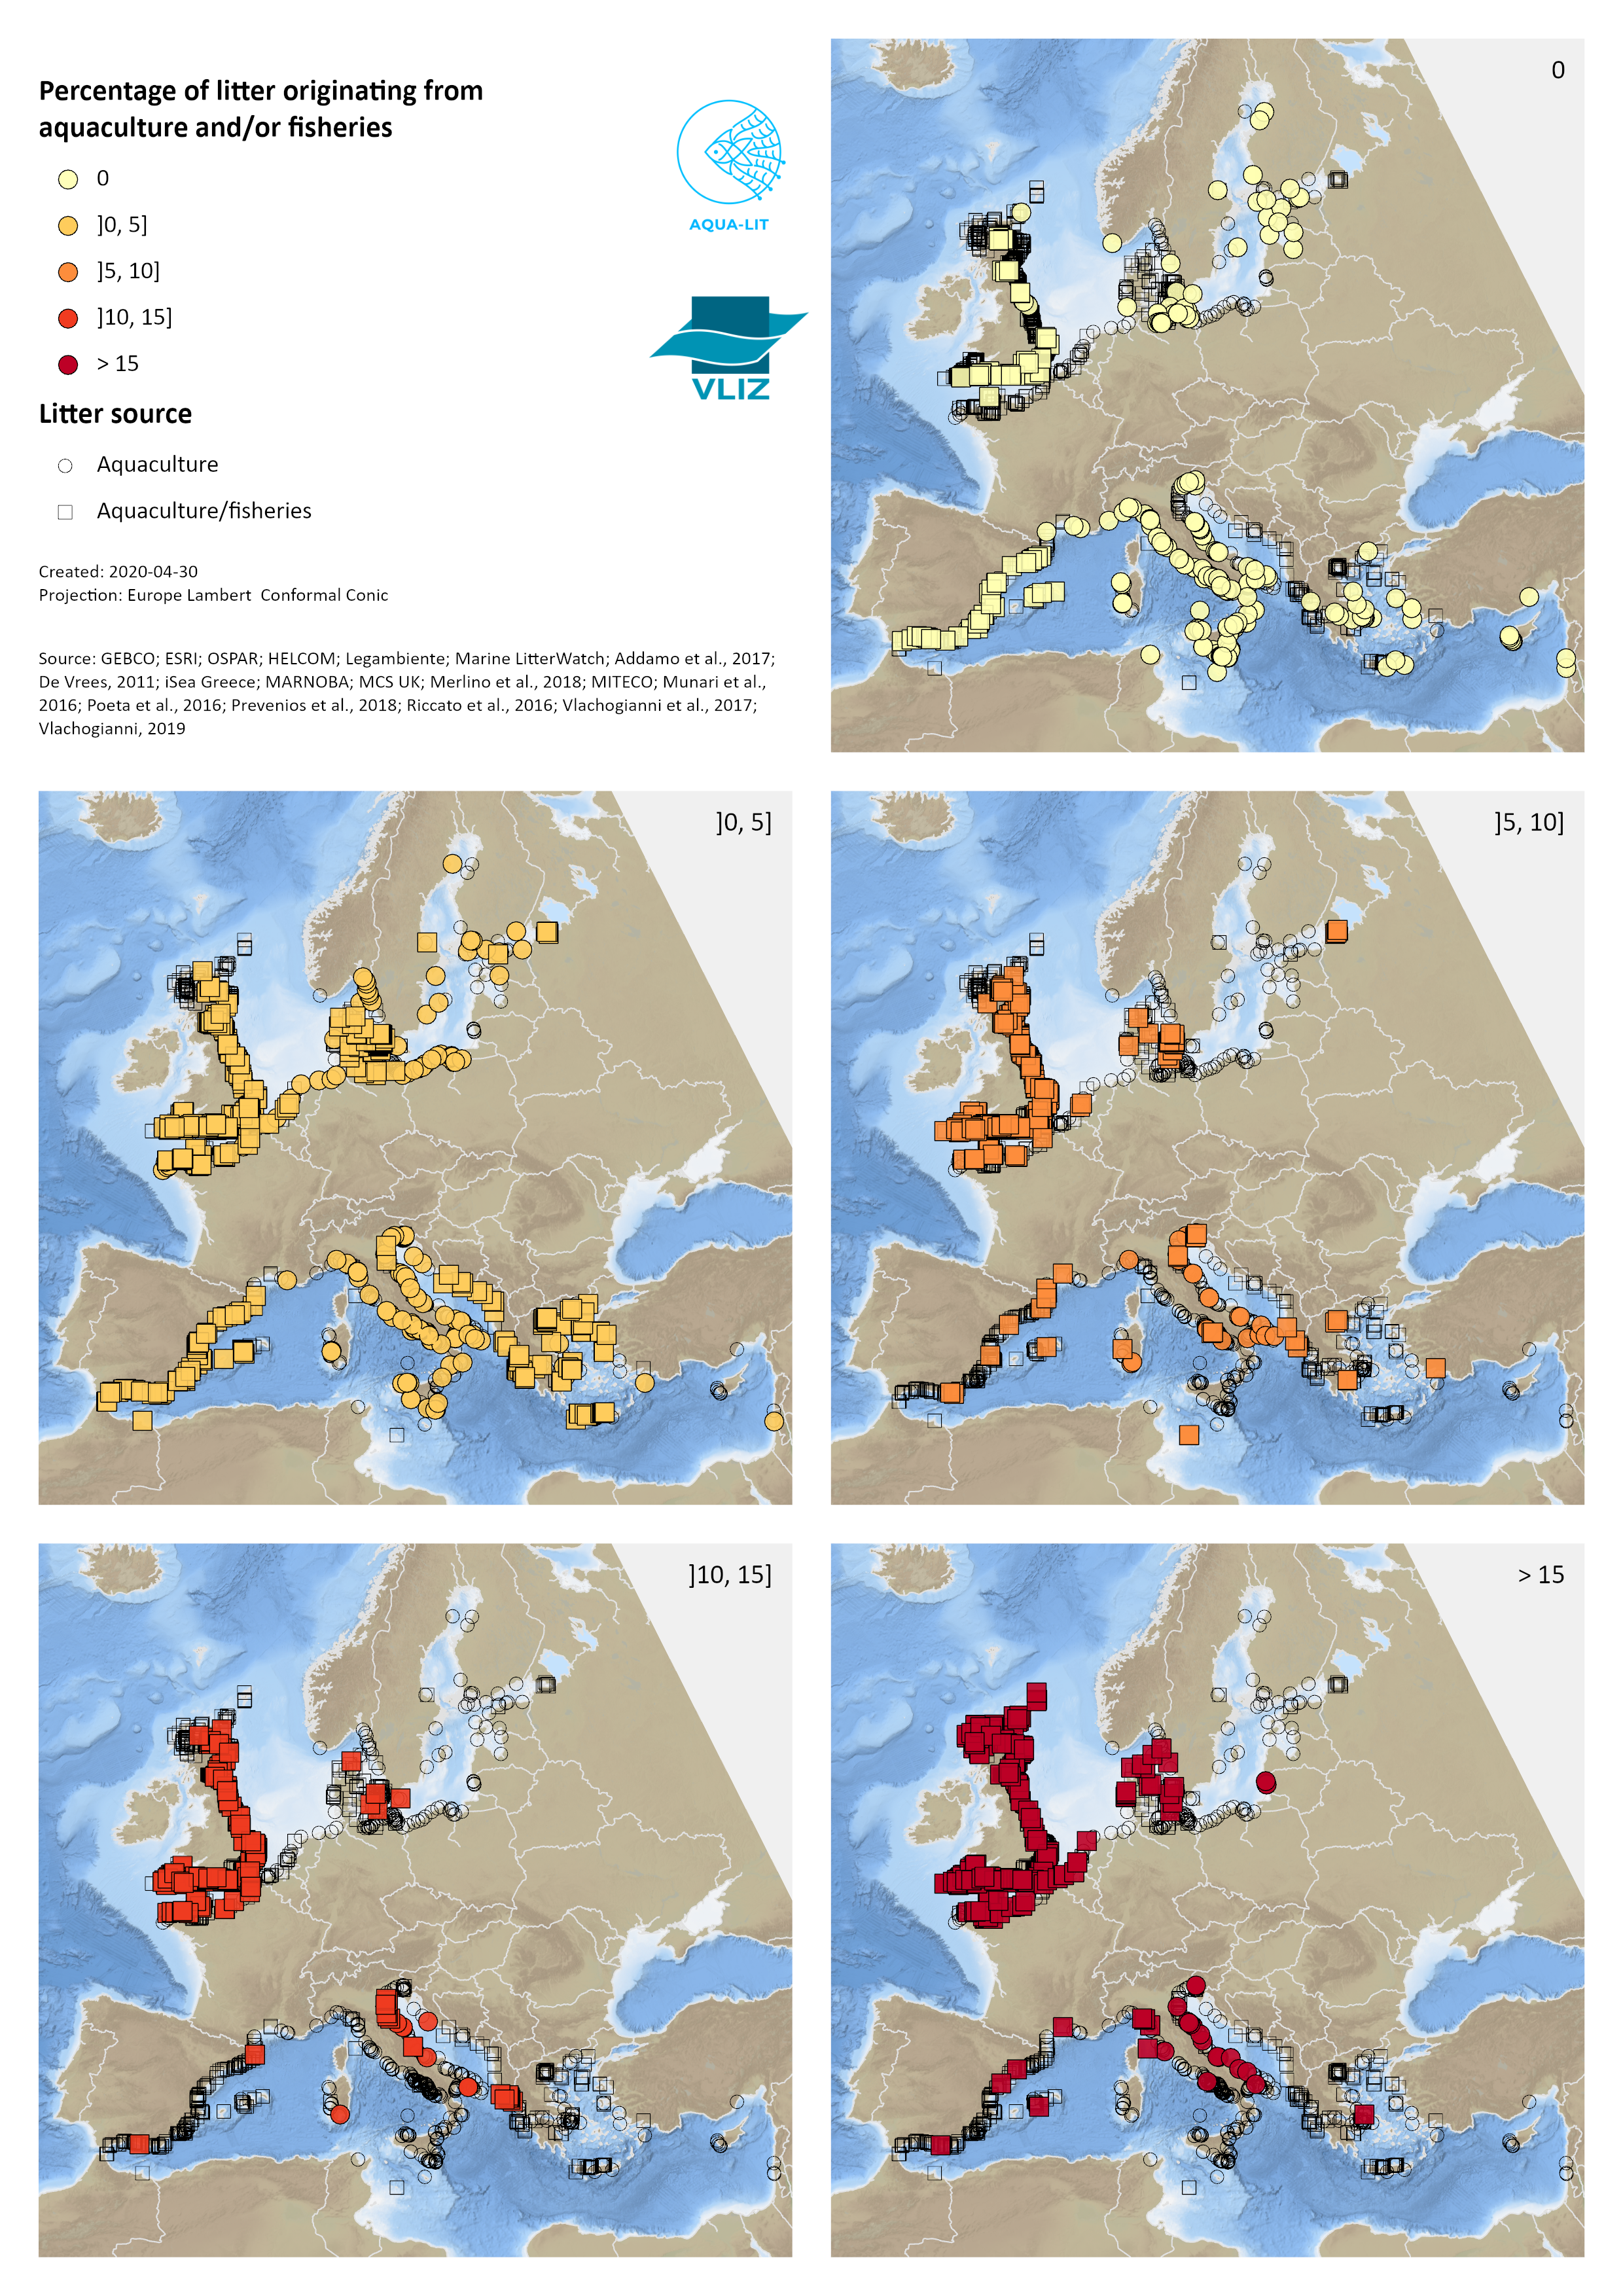
In general, beaches in all three sea regions are well represented with the exception of the North African beaches. Most European beaches have relatively low percentages of aquaculture related litter, with some exceptions.
A little more than 80% of the data points in the North Sea region are located along the British coastline, 44% of which has a share of aquaculture debris of 10% or higher. In Scotland, Shetland and the Orkney Islands considerably higher proportions of aquaculture items were found compared to other British beaches. Belgium, Denmark and France also have several beaches with high percentages of aquaculture related debris.
Interestingly, almost the entire Baltic Sea region (expect for Denmark) shows relatively low numbers of aquaculture debris. This is consistent with the limited aquaculture activity in the Baltic Sea and suggests that aquaculture debris coming from the North Sea and outer regions does not extend beyond the straits connecting both seas.
In the Mediterranean Sea, the highest shares of aquaculture debris are found in the Adriatic Sea, mainly along the Italian coast. On almost 16% of the European monitored beaches, no aquaculture related debris was found.
------------------------------------------------------------------------------------------
Sea surface
The observational transects in the North, Baltic and Mediterranean Sea basins and their reported percentage of aquaculture related litter.

All information was collected during visual surveys, and all convenient data were related to both aquaculture and fisheries activities. In other words, none of the litter items were uniquely linked to aquaculture. The surveys were exclusively performed in the Mediterranean Sea and an average of 11.3% of the detected debris was related to aquaculture and fisheries. In the Ligurian Sea and the Gulf of Lion a wider area is highlighted in the figure above. This polygon represents a series of transects which were monitored during multiple visual surveys by the same research group (Di-Meglio et al., 2017). In this area the proportion of aquaculture related litter in relation to the total amount of recovered litter is approximately 9.5%.
------------------------------------------------------------------------------------------
Seabed
The locations of the seafloor surveys in the North, Baltic and Mediterranean Sea basins and their reported
percentage of aquaculture related litter
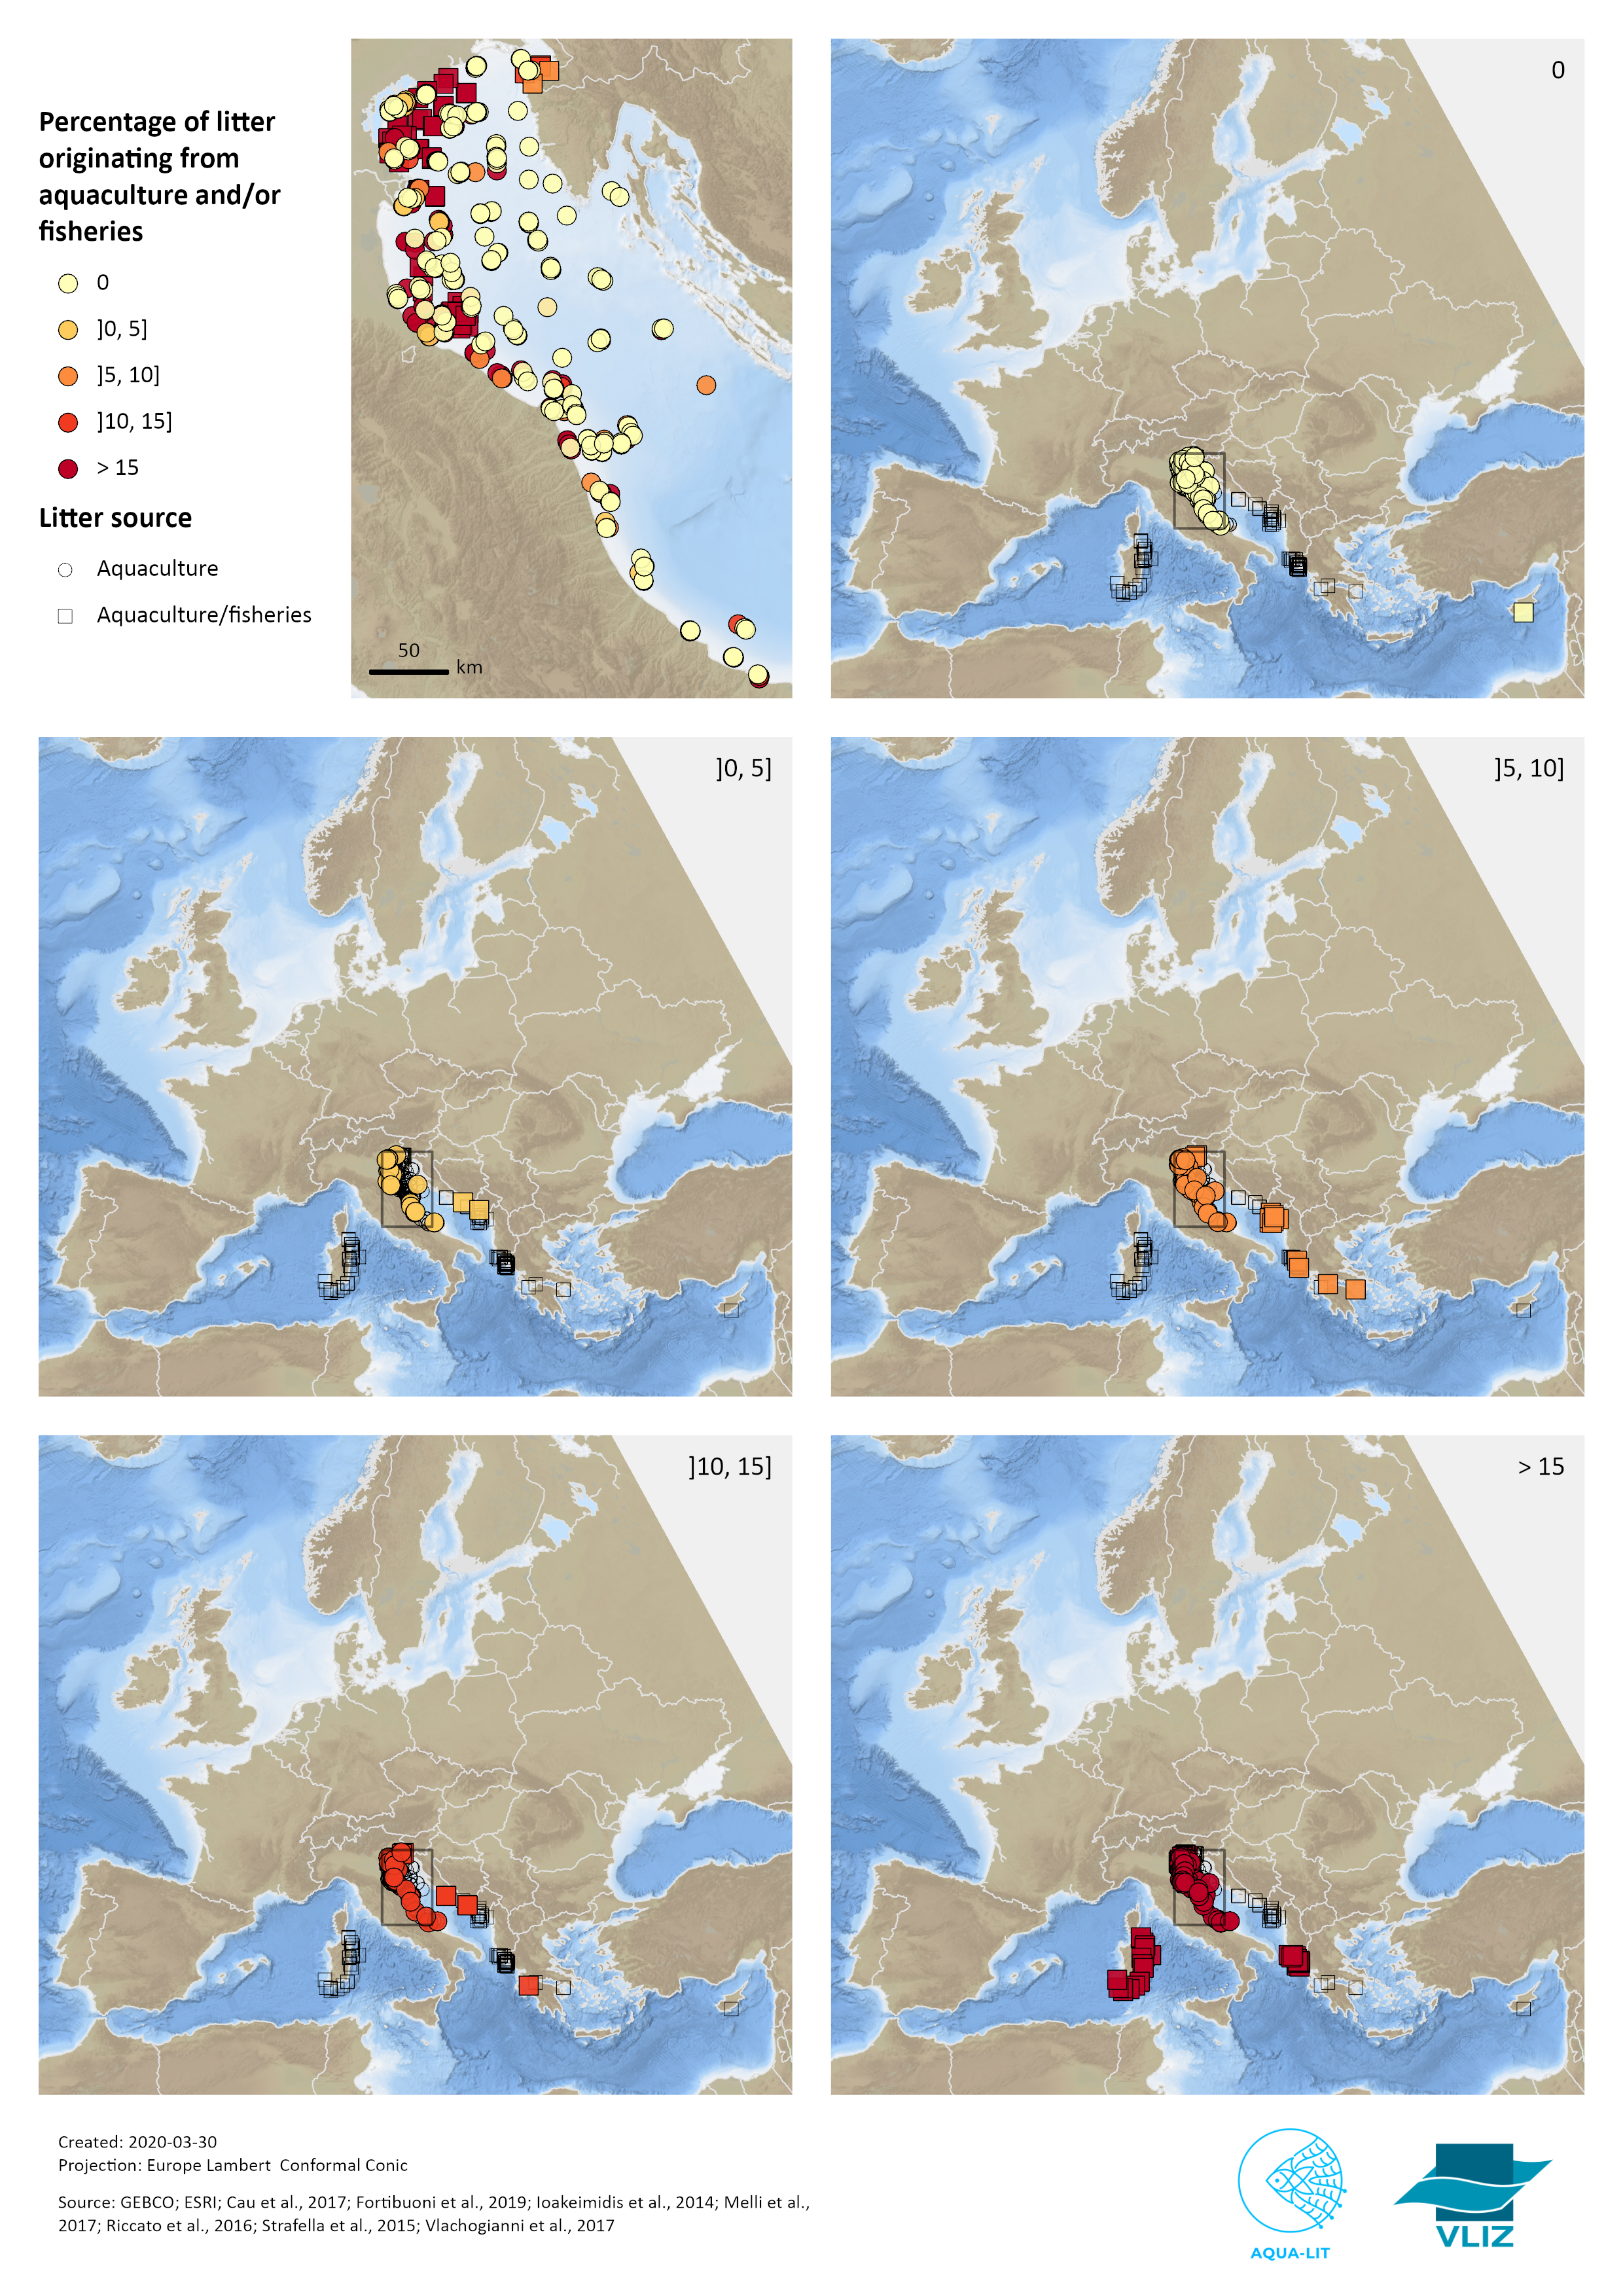
Seafloor litter data are exclusively available for the Mediterranean Sea basin, more specifically the Adriatic Sea, parts of the Ionian Sea, and the Eastern and Southern waters of Sardinia. Interestingly, in the Adriatic Sea, coastal regions show higher proportions of aquaculture related debris than offshore locations. The average percentage of aquaculture related debris on the seafloor is 14.8%. Nevertheless, when only the specific items are taking into account, the average percentage of aquaculture debris is only 11.6%. For same reasons as explained in the section ’Beach litter’, the latter can be seen as the lower limit of aquaculture related debris on the seafloor.
The first proportion indicated, can be seen as the upper limit. On almost 38% of the monitored seafloor locations, no aquaculture related debris was found.
In comparison with the beach (2.4 – 9.2%) and sea surface (11.3%) data (see sections ‘Beach litter’ and ‘Floating litter’ above), one can conclude that the highest average proportion of mariculture related litter in relation to the total amount of litter is found on the seafloor.
However, these surveys only took place on the seabed of shallow waters. Hence, no statements can be made on the amount of litter in deeper waters.

For seeing the full report please go to our Deliverables section and download D2.2 Knowledge wave on marine litter from aquaculture sources.